
PowerCharts is a XT based HTML5 and JavaScript control charts, network diagrams, can be used for performance analysis, profit analysis, financial planning, and draw the stock price and the level structure in the field of advanced professional chart control. He is interactive, powerful, simple operation, can help you add a rich, immersive experience for your application. Also, many diagrams can be visually edited, and you can also use them to draw a situation map, and the edited values can be submitted to the server.
Specific description:
Heat, Map
Heat, Map mainly uses a variety of colors to display data in a tabular form, such as minimum, average and maximum values. Used to draw complex data for a variety of company performance comparisons, cycle tables,employee attendance, stock market investment and other fields.

Radar map
The radar map is a very handy tool for comparing the different characteristics of multiple entities, such as fuel efficiency, mobility, transmitter power, and starting time for different vehicles.

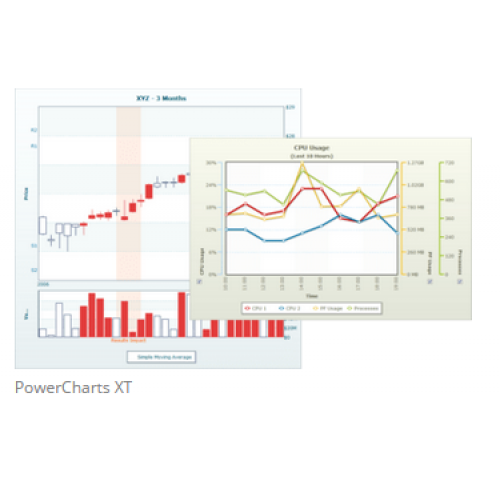
Candlestick Charts
Candle charts are often used to analyze stock and commodity prices, and candles can be used to display opening prices, closing prices, top trading prices, and minimum trading prices, as well as the number of transactions in a single chart

Waterfall graph
A waterfall chart is often used to indicate that a value is added or reduced to a final value. Both the start and end values are represented by a histogram. Usually two different colors are used to indicate the increase or decrease of the positive and negative values.

Editable Charts
PowerCharts XT provides a visual drag chart can be used in bar charts, line graphs and maps can be visualized editing of data through a simple drag, and the drag values after feedback to the server.

Multi-level Pie Charts
PowerCharts XT provides a multi-layer pie chart for visually displaying multi tier data and displaying symmetric or asymmetric hierarchical structures.

Drag Node Chart
Drag Node Chart is a powerful graphical rendering tool that creates visual, edited network diagrams and organizational diagrams that can be visually edited, modified, and saved to the client.

Error Charts

Box & Whisker Chart

Step Line Chart

Kagi Chart

| Component Property | |
| Component Type | HTML5、JavaScript |
| Component Environments | HTML5、JavaScript |
| Version | 3.11.3 |
标签: PowerCharts XT